Gordon Prentice at Large - Politics in Newmarket




- Details
- Written by: Gordon Prentice
Now we can get a full frontal in-your-face view of the Monster House at 1011 Elgin Street. 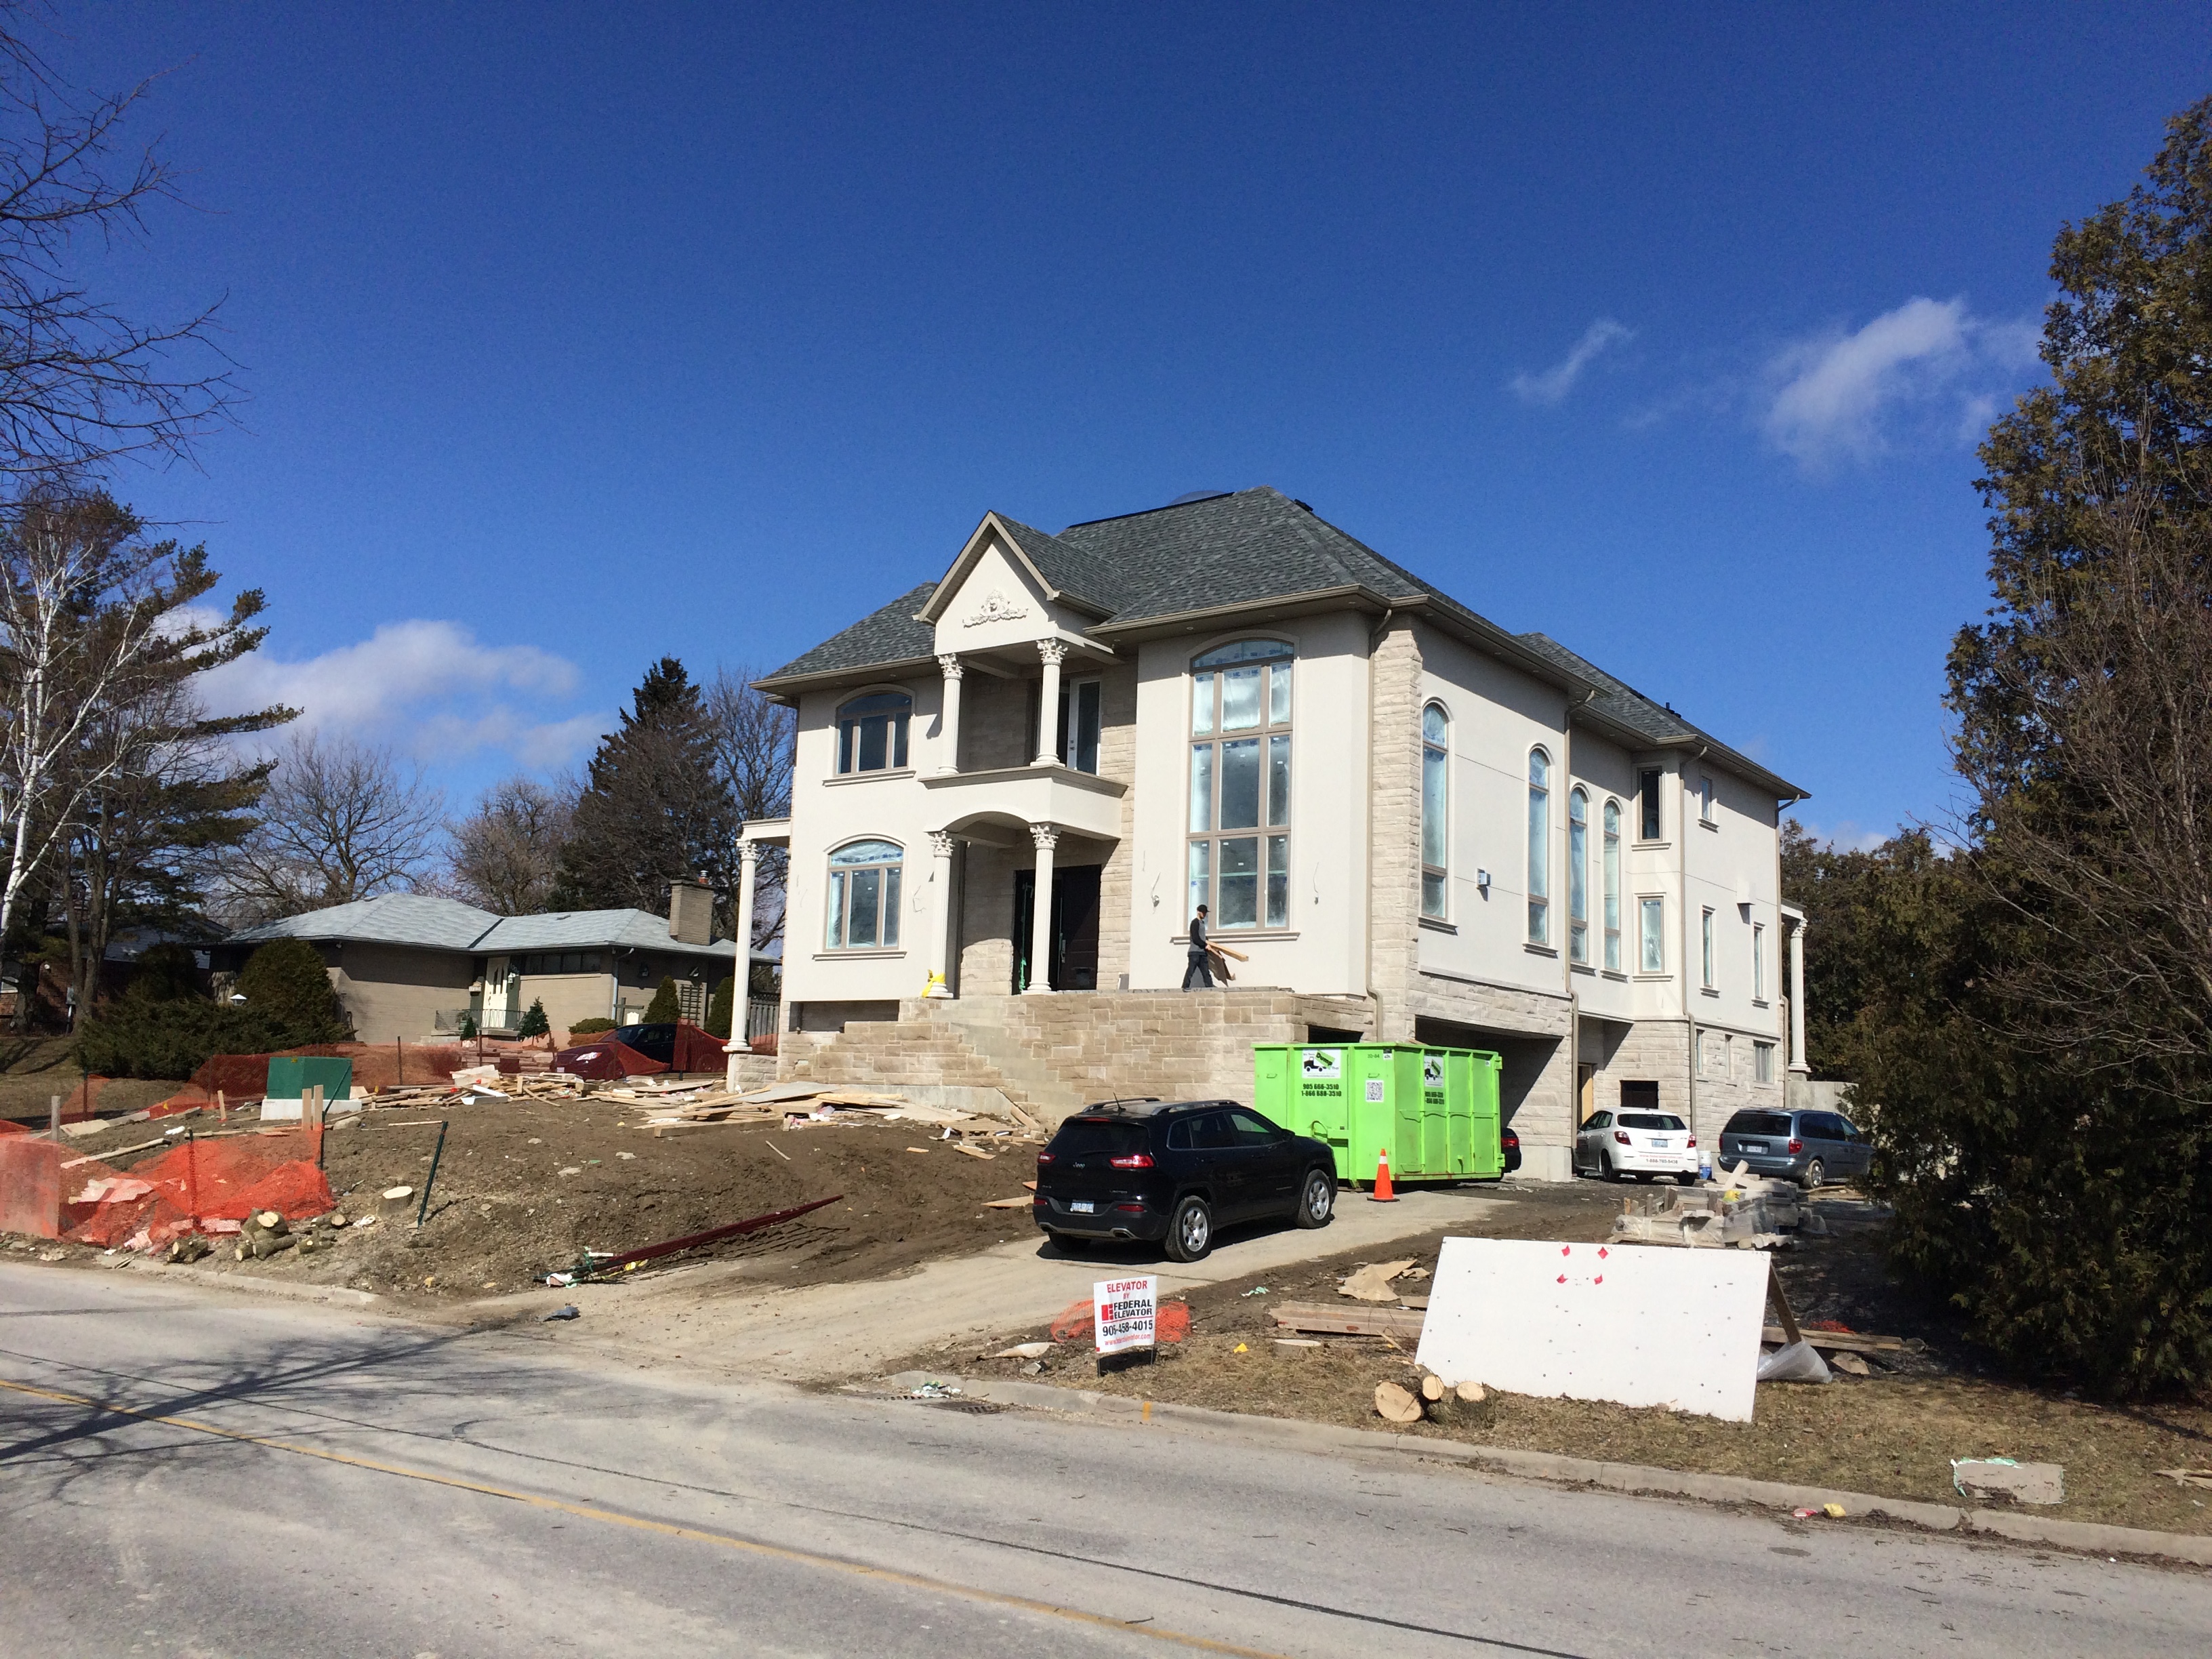
On Monday (2 April) the tree inconveniently situated in front of the house was chopped down on the orders of the owner, Morad Dadgar.
It is clear beyond any argument that the Town has signally failed to protect the neighbourhood from this towering structure which now dominates the street. It even has LED lights under the eaves so we can expect the exterior to be floodlit at the flick of a switch any time the owner chooses.
At last week’s Council Workshop on “intensification in stable residential areas” (26 March 2018) councillors considered possible new approaches to the Town’s Zoning By-laws that would offer some kind of protection to existing residents.
The longest serving councillor in Canada, the inquisitive Dave Kerwin, innocently asks Senior Planner, Dave Ruggle, if another giant house could be built alongside 1011 Elgin.
Yes says the planner. The house meets Town’s the zoning standards.
Useless by-laws
The Town’s zoning by-laws are so useless that there is nothing to stop Mr Dadgar or one of his relatives from tearing down the bungalow next door - which they also own - and building Monster House 2.
Kerwin’s colleague and Council jewel, Bob Kwapeese, is concerned about what may happen across the Town between now and when any new Zoning By-law regime is brought it. He says there is already a rush to sever lots to squeeze in more new developments. Dave Ruggle says if the Council wants to stop any development it could issue an “Interim Control By-law”.
Oh no no! says Van Trappist, the developer’s friend.
“That would be the nuclear bomb option!” 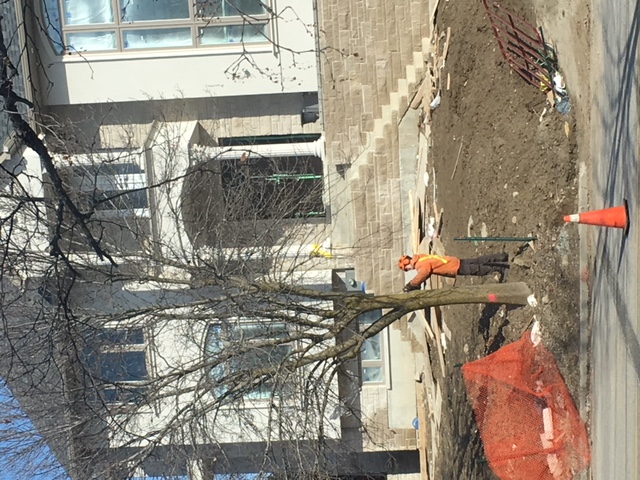
If a Monster House was gonna be his next door neighbour in London Road the old banker’s finger would already be hovering over the nuclear button.
A long list of councillors line up to express regret or concern about 1011 Elgin Street and its impact on the neighbourhood. Ward councillor Jane Twinney says it doesn’t fit in. John Taylor says it boggles the mind that the Monster House occupies less than 35% of the total lot area – as required by the Zoning By-law.
Emerging issue
Tom Vegh talks fancifully about infill development as an “emerging issue”. As if the Town is cleverly taking steps to address a problem which is only now manifesting itself. Complete baloney! This was an issue the rest of us – including the Director of Planning in 2012 - could see coming.
Christina Bisanz talks of protecting the character of residential areas. She hopes this protection will not just apply to neighbourhoods of her vintage or older! She makes the case for protecting newer neighbourhoods from inappropriate infill.
We are told that within 60 days the planners will be ready to present a report to Council on how best to tighten up the Zoning By-laws to stop developments like 1011 Elgin from blighting entire neighbourhoods.
Taking it all on trust. 
Councillors are told by the planners that 1011 Elgin Street meets the Zoning standards and we take that on trust. We still haven’t seen the height and the lot coverage independently verified by a qualified Ontario surveyor but that’s not going to happen unless councillors insist on it. It’s not on the cards.
Ages ago the Director of Planning, Rick Nethery, asked the owner, Morad Dadgar, to let the Town have sight of the property survey but he, Nethery, was ignored.
If not, we would have been told about it.
As it is, no-one takes responsibility for the Monster House at 1011 Elgin Street.
No-one goes nuclear.
It’s just one of those things.
- Details
- Written by: Gordon Prentice
This morning, Toronto Star columnist Heather Malick gently mocks Doug Ford who tells us the Provincial Government is responsible for massive tax hikes.
“Today’s budget includes massive – I repeat, massive – tax hikes… a family of five will be paying $1,000 more in new taxes.”
Doug Ford 28 March 2018
But only if each person in this “family of five” earns $130,000 or so. I am chortling again! 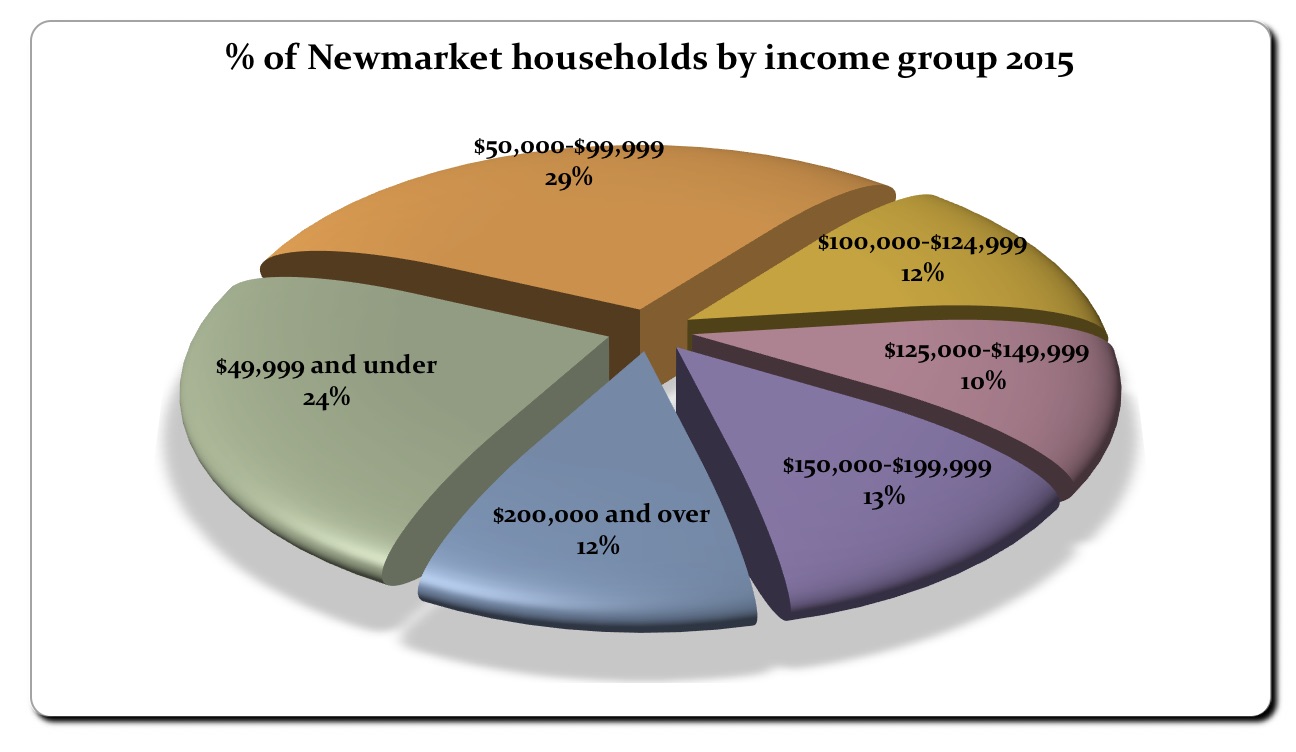
As it happens, I have been wondering if such an unusually well-heeled family of five actually exists anywhere in Newmarket (or Aurora) where the average household size is 2.94 persons.
Above average incomes
Generally speaking, Newmarket and Aurora are well-off towns with higher than average incomes but there are thousands of people struggling to get by and pockets of deep poverty. (The pie chart on the right shows total household income.)
Most people in York Region – and here in Newmarket - can only dream about getting $130,000 a year, thereby qualifying for the $200 tax hike which Doug vows to scrap.
Unaffected
Over 83% of Ontario’s 11m tax filers are entirely unaffected. The Budget document tells me about 680,000 individuals would see a reduction of about $130 in their income tax on average.
Doug thinks this is a tax grab. The Provincial Government says it’s a bit of overdue spring cleaning – getting rid of surtax and bringing in seven Personal Income Tax rates making the tax regime a bit more progressive. (You can read the Budget speech here.)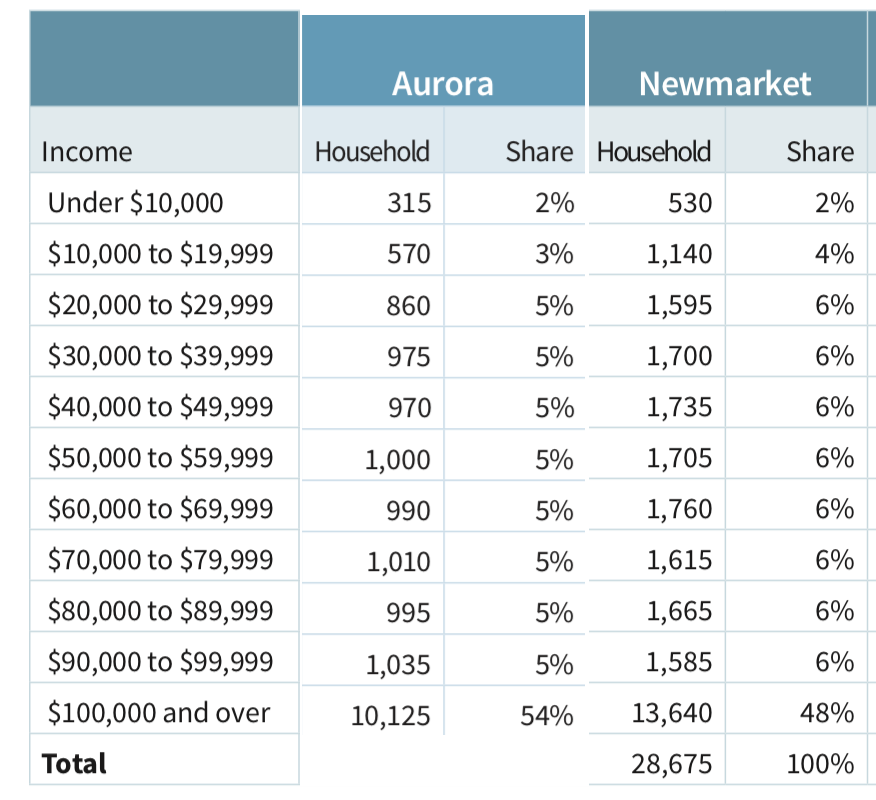
The Liberal Government has now laid out its stall but what are the PCs offering?
At the moment, not a lot.
Policy vacuum
I am looking forward to reading Doug’s election platform to see how he makes his sums add up. Cos at the moment they don’t.
Perhaps he will take Jamie Watt’s advice and just be himself, leaving policy detail to others. Watts says
“Unfiltered Ford has the best chance”.
I doubt it.
Soundbites and empty slogans won’t cut it in this election. Doug has got to come up with concrete policies and costed programmes.
Or be relentlessly mocked for being all mouth but with nothing to say.
Update on 1April 2018: Blog now shows number of taxpayers getting a tax cut.
- Details
- Written by: Gordon Prentice
580 new jobs were created in Newmarket from 2016 to 2017 – an employment growth rate of 1.4%.
Our neighbour to the South, Aurora, saw 1,070 new jobs created over the same period – a growth rate of 4.5%. 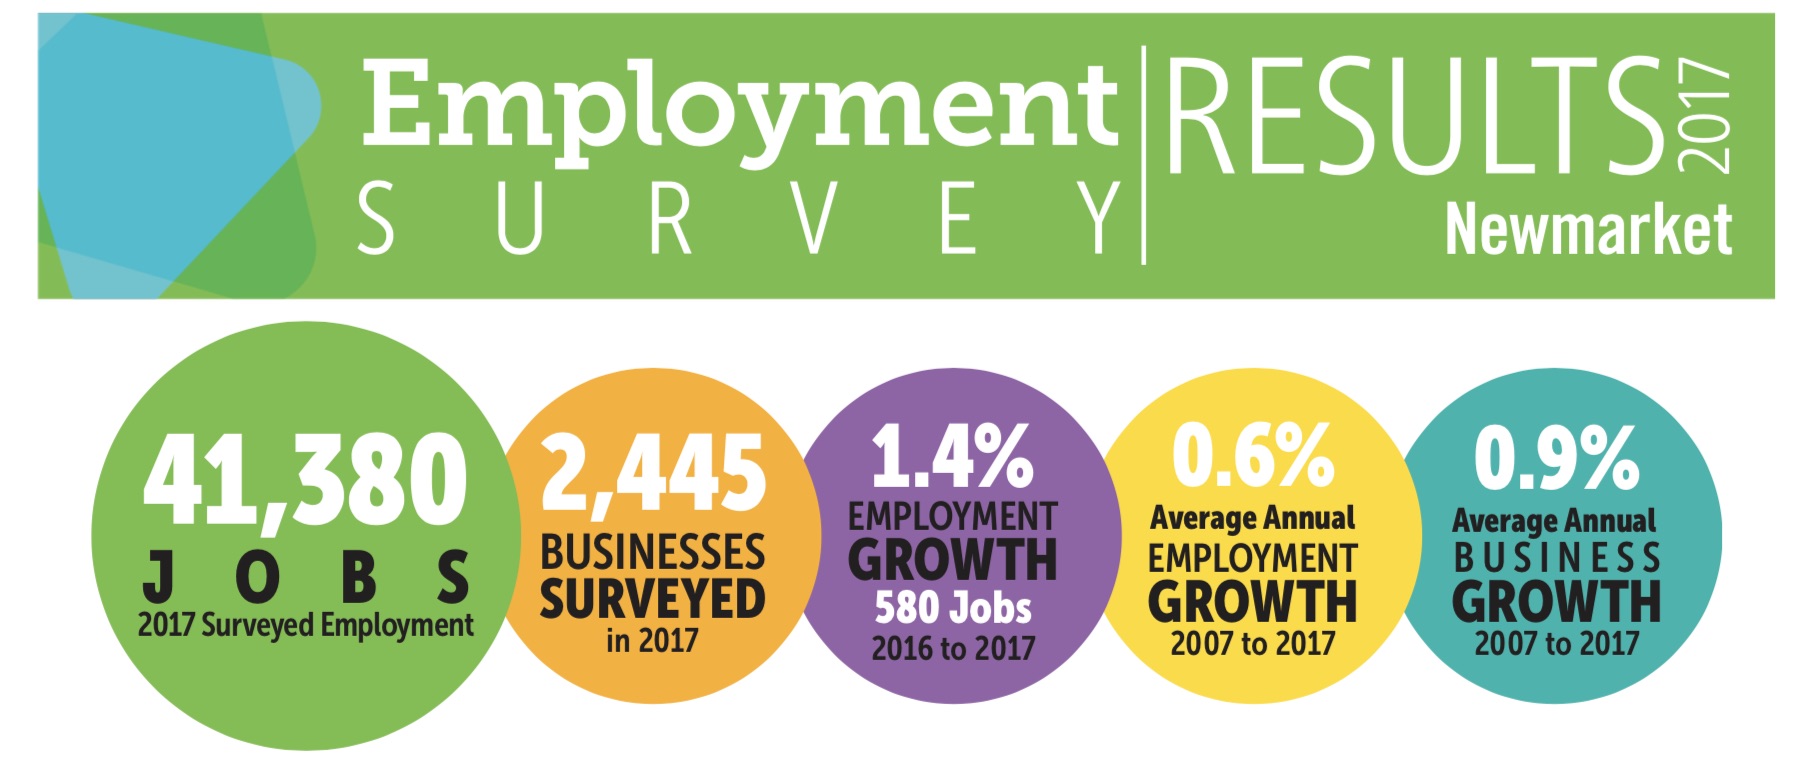
Aurora consistently beats Newmarket in job creation. Since 1998 Newmarket has seen 9,600 new jobs. Aurora, 13,950.
Over the last decade Newmarket has seen an average annual business growth of 0.9%. The comparable figure for Aurora, 2.8%.
Why does Aurora grow more jobs?
Why is this? Does Aurora have more employment land? Or is it because it is closer to Toronto? Or are housing options more varied? What exactly are the factors?
You can see all the figures here in the 2017 Employment Survey Results for the nine municipalities of York Region.
There was a terrible kerfuffle three years ago when the Region published figures which suggested Newmarket had seen a paltry 100 jobs created over the period 2009-2014. At the time, I was sitting in on a York Region meeting and observed the look of incredulity on the faces of John Taylor and Tony Van Trappist.
Indeed, Van Trappist was actually moved to say something - as was Taylor. (The 100 figure was subsequently revised upwards.) Since then the Employment Surveys for individual municipalities are no longer front and centre. At York Region they’ve taken a back seat to region-wide figures and analysis. That way less likely to cause embarrassment.
As it happens, the Town’s Economic Development Officer, Chris Kallio, gave a presentation to the Committee of the Whole on 26 February 2018 entitled: 2017 Economic Development: the Year in Review.
Upbeat and breathless
It is all very upbeat and breathless with lots of pace, flagging up big new employers such as Celestica (a high tech company) and Gin-Cor (who make specialist vehicles) that are moving into Town. You can see the presentation which comes at the start of the meeting here on You Tube. 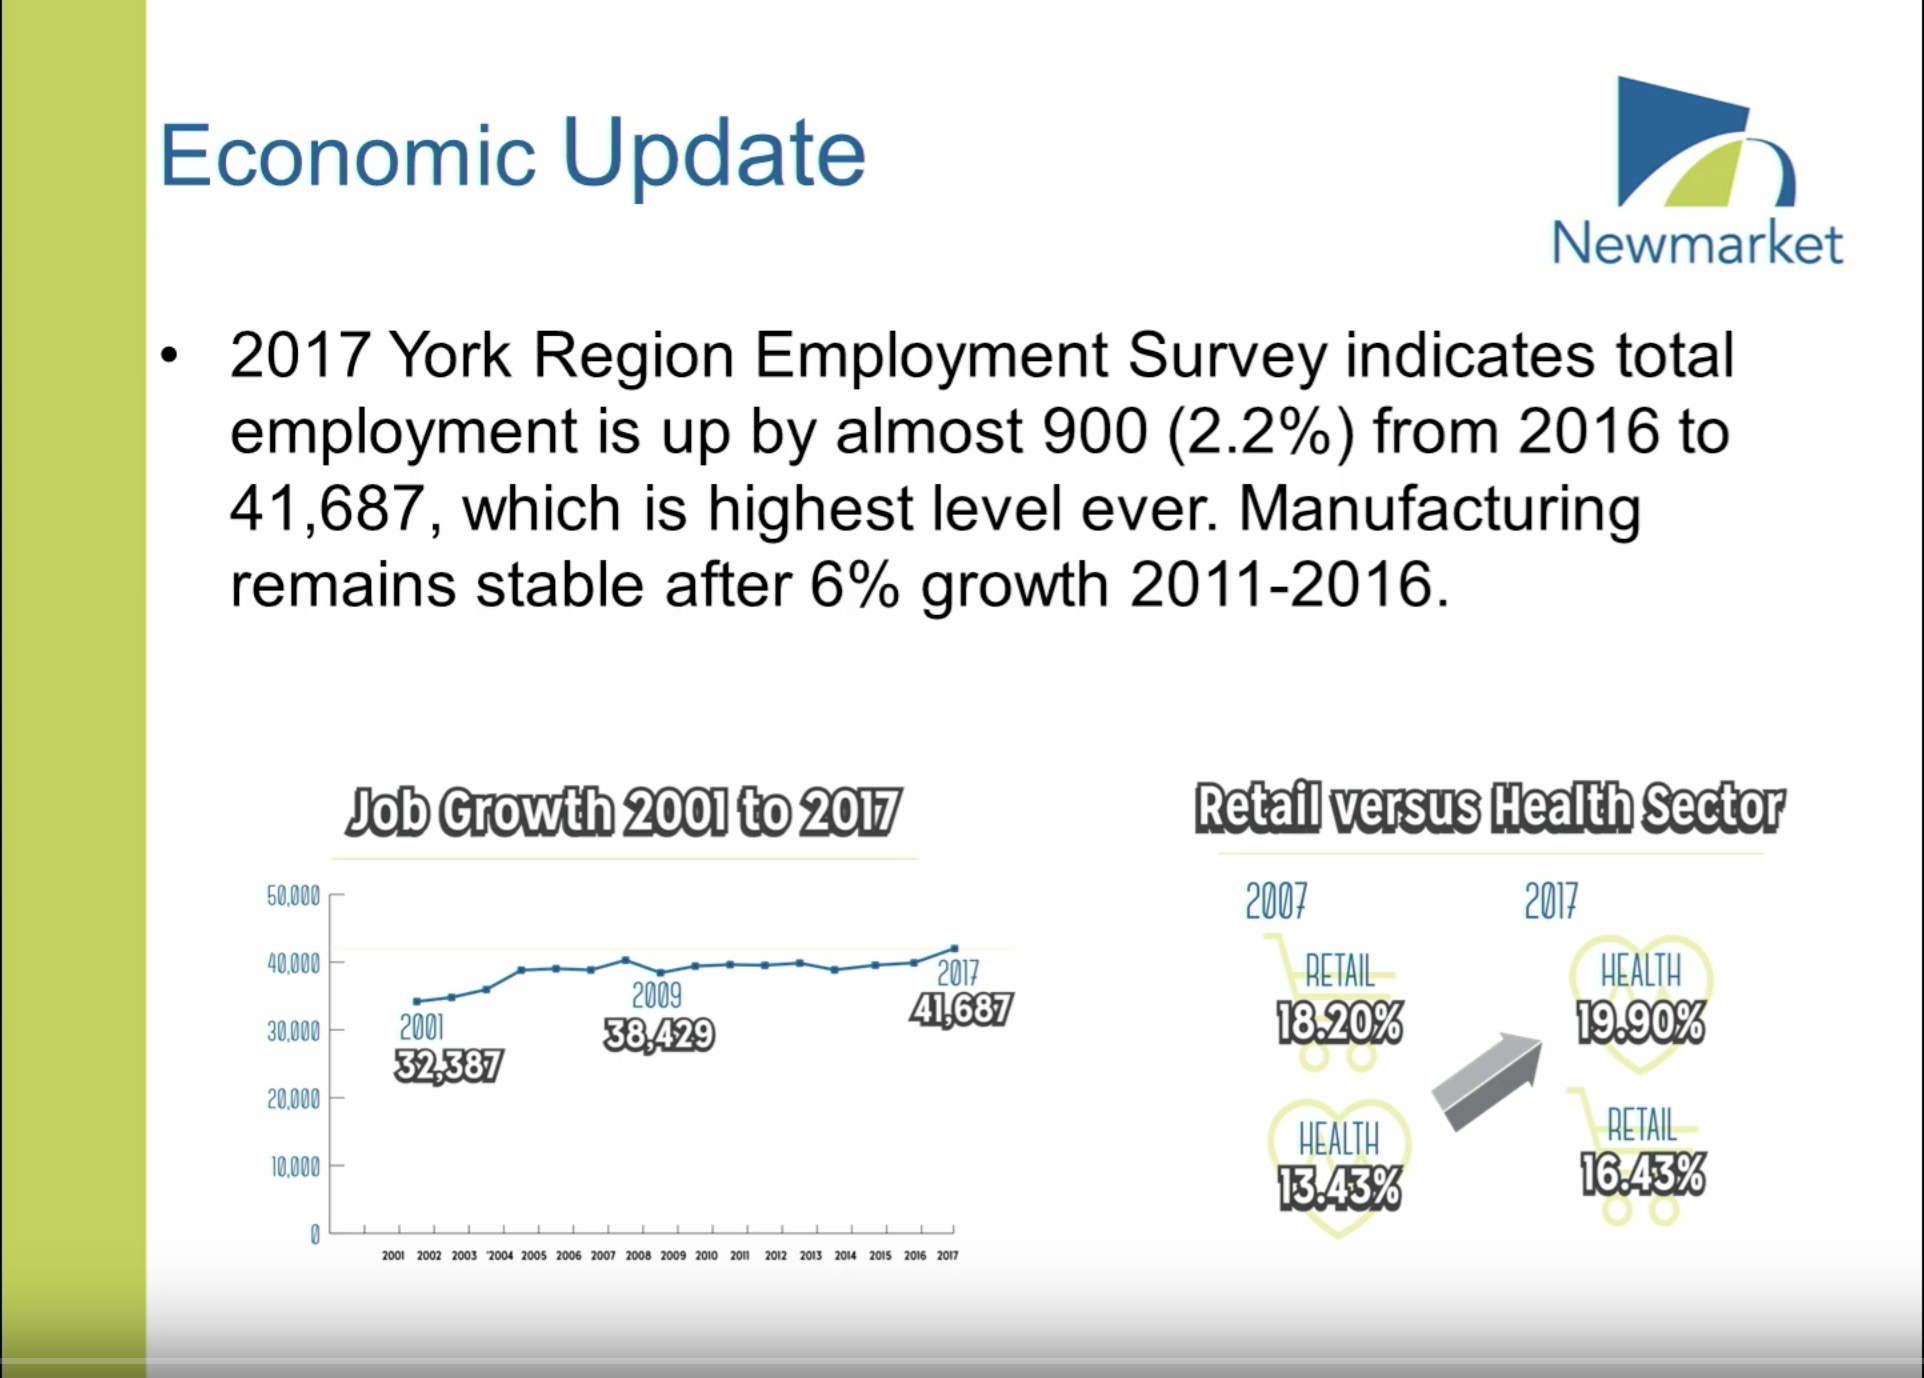
But instead of the 580 new jobs I was expecting I see 900 and instead of employment growth of 1.4% I see 2.2%
The slide alongside credits the information as coming from the 2017 York Region Employment Survey. Perhaps the Town uses the calendar year whereas the Region uses the survey period from mid-year 2016 to mid-year 2017. Perhaps the answer lies in the definition of "total employment". In any event it is important we compare apples with apples, especially in an election year.
Big new employers not in the latest figures
John Taylor, who sits on the Regional Council, asks if the 2017 figures include the numbers from Celestica and Gin-Cor and is told no.
He points to jobs on the way at Upper Canada Mall, the Oskar Building on Davis Drive and the old Price Chopper on Leslie Street which is morphing into a new medical centre. He is upbeat.
You can read York Region’s 2017 Economic Development Review here and the Region’s February report here which focusses more on job growth.
York Region is on steroids, growing fast:
Employment growth in York Region has outpaced national, provincial and Greater Toronto Area (GTA) employed labour force growth between mid-year 2016 and mid-year 2017, posting a gain of 3.3%, a slightly lower growth rate than 2016 (3.6%).
Over the past five years York Region has grown at an average annual rate of 3.2%, outperforming growth rates in the national (2.1%), provincial (1.8%) and GTA (1.4%) economies.
According to York Region’s employment survey, employment rose to an estimated 620,530 jobs in 2017, an increase of 3.3% or 19,780 jobs from 2016.
But, worryingly, the big growth in contract work continues.
Between 2007 and 2017 the number of contract/seasonal/temporary employees has been steadily increasing. In 2007 the share of this employment category was 4.5%, while in 2017 it was 13.4%. As the share of contract/seasonal/temporary employment increases, full-time employment has decreased from 76% in 2007 to 69% in 2017. Although full time employment remains strong, the steady increase of contract/seasonal/temporary employment is indicative of the shifting job market since the 2008-2009 economic downturn and the rise of contract work that followed.
Precarious employment is a big and growing issue.
Time for us to wake up and take notice.