Gordon Prentice at Large - Politics in Newmarket





- Details
- Written by: Gordon Prentice
Yesterday, I sat through the first day of the trial at Newmarket's Small Claims Court. 
Former Newmarket Councillor Maddie Di Muccio is trying to extract $5,000 in damages from John Taylor for defamation and reputational damage.
Her action against Taylor has been dragging on for absolutely ages. She dropped her libel action. Then she amended her claim. It is time to put a line under it and end the circus.
And though she believes Newmarket Council has become
"a cesspool of failed Provincial candidates"
she should now move on with her life. She has tried twice for the Progressive Conservative nomination for the Provincial Parliament and both attempts have ended in bitterness and acrimony. There is not going to be a third time.
Queen's Park is not for her.
I can tell her now, having heard the evidence in its entirety, she will fail. No doubt about it. If she wants to save herself more mental suffering she should gracefully bow out and call it a day.
For those with the stamina to read more about Maddie Di Muccio, my blog on the trial is here. The background documents are here.
Update on Sunday 12 February 2017. Since posting this blog, I've come to realise just how difficult it is to locate the ad which Di Muccio placed in the Newmarket Era on April 10, 2014, using taxpayers' dollars. It is at the centre of the defamation action brought by Di Muccio against John Taylor.
The ad seems to have vanished completely from the internet. However, you can view it here in the bundle of documents submitted by John Taylor to the Court. (Open Di Muccio v Taylor, second from the top and scroll to page 36.)
Is this advertisement a proper use of public funds?
The York Region Taxpayers Coalition presumably thinks so.
- Details
- Written by: Gordon Prentice
The first batch of data from last year's census is published this morning. The statistics focus on population growth and housing.
And what does it tell us about our Town? 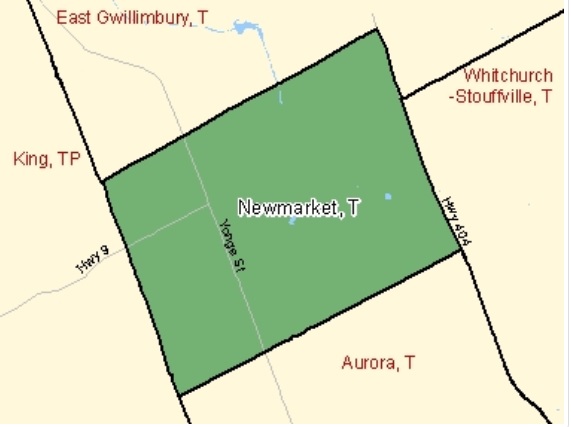
The population of Newmarket is now 84,224 - up from 79,978 in 2011.
This is an increase of 5.3%, just higher than the national average of 5%.
By contrast, Aurora's population increased by 4.2%
Newmarket's percentage growth slows
Between 2006 and 2011 Newmarket's population grew by 7.6%, well above the national average growth of 5.9%.
The total "private dwellings" is 29,315. (Statistics Canada defines these as a separate set of living quarters where you don't have to pass through someone else's living space to get to your own.)
Private dwellings occupied by usual residents 28,673 - up from 27,409 in 2011. (A "private dwelling" is where a person/s permanently resides.)
Population density per sq kilometre is 2,190 compared with 3.9 for Canada as a whole.
And we are all squeezed into 38.45 square kilometres.
Whitchurch-Stouffville: the town on steroids
The population of Whitchurch-Stouffville grew by a whopping 21.8% between 2011 and 2016.
Our immediate neighbour to the north, East Gwillimbury, grew by 6.8% between 2011 and 2016 but future population growth is going to be turbocharged.
- Details
- Written by: Gordon Prentice
On Thursday (9 February) members of York Regional Council will get a presentation on employment growth across the Region with updates on how industry and businesses are faring. 
We are told York Region employment growth
"outpaced national and provincial labour force growth between mid-year 2015 and mid-year 2016, growing 3.1%."
This is good.
We learn that overall
"There were an estimated 595,200 jobs in York Region as of mid-year 2016 with employment increasing by 15,100 from the previous year. Employment growth continues to outpace national and provincial averages. Full time employment represents 71% of all jobs in the Region, a decline from 73% in 2015."
But all information which is specific to the nine constituent municipalities has been stripped out of the report, making comparisons between, say, Newmarket and Aurora impossible. The last time the information was included (in the 2014 Report) there was a great kerfuffle with Newmarket's Tony Van Trappist speaking out (unusually) and crying foul!
Information is available - but only if you ask
Employment information by municipality comes from surveys carried out across the region. But this information is only made available to elected officials and to municipal staff and not to the great unwashed - unless we make a big song and dance about it.
Why not be up front with the data? It is a bit like having an economic survey of Canada without referring to the Provinces by name, with no comparisons allowed. 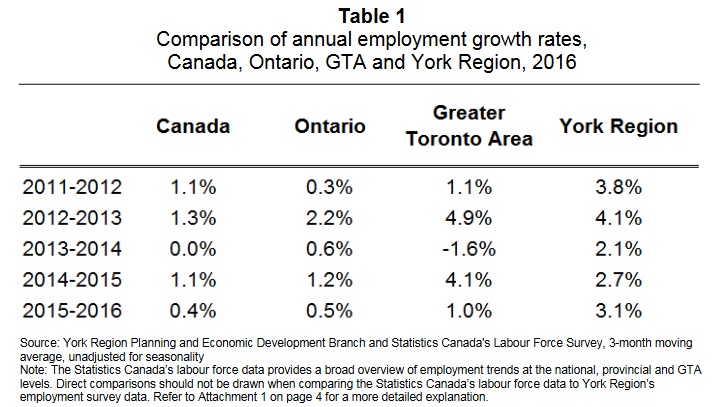
Paul Bottomley, the Region's Manager of Policy, Research and Forecasting, told Council members this time last year the details for the individual nine municipalities did not form part of his presentation.
He said council members had been given the information separately in a handout.
As it happened, I was physically present at the Committee meeting. I intercepted him as he was leaving the Council Chamber and asked for sight of these documents. (Scroll to bottom of page and open.)
I asked if these were "public documents". He conceded they were. He emailed them on to me an hour later.
But why do we have to ask?
Open Data
York Region and Newmarket trumpet the fact they are Open Data authorities.
So why can't the data for the nine constituent municipalities be attached to the main report as an appendix?
People are interested in this kind of stuff.
Is it to avoid embarrassing under-performing municipalities? Is the local data seen as a distraction from the main point?
What is the reason for keeping this stuff under wraps?
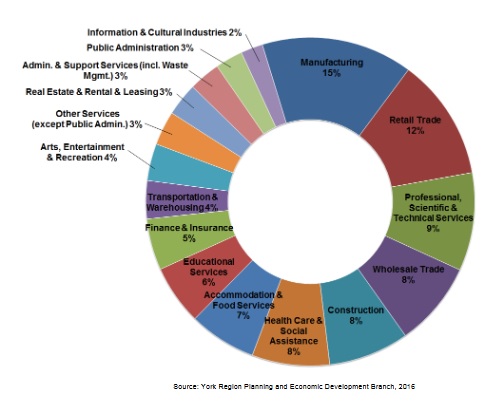
The pie chart (above) gives details of job distribution by category across the Region. But why can't we have pie charts for each of the nine municipalities?
Of course, when publishing data there are always the caveats. You've gotta compare like with like. No point comparing muscular Markham with, say, rural King.
But surely we can we compare Newmarket with, say, Aurora, our nearest neighbour to the south.
They are almost part of the family.